安装配置
prometheus支持多种安装方式,为了便于理解,我们先用二进制方式进行部署。
下载prometheus
- 访问
prometheus官网https://prometheus.io/download/下载prometheus
wget https://github.com/prometheus/prometheus/releases/download/v2.55.0/prometheus-2.55.0.linux-amd64.tar.gz

# 加速地址
wget https://mirror.ghproxy.com/https://github.com/prometheus/prometheus/releases/download/v2.55.0/prometheus-2.55.0.linux-amd64.tar.gz- 解压
prometheus至指定目录
tar xf prometheus-2.55.0.linux-amd64.tar.gz -C /etc
ln -s /etc/prometheus-2.55.0.linux-amd64/ /etc/prometheus- 执行命令查看是否正常
/etc/prometheus/prometheus --version
prometheus, version 2.55.0 (branch: HEAD, revision: 91d80252c3e528728b0f88d254dd720f6be07cb8)
  build user:       root@9fad779131cc
  build date:       20241022-13:47:22
  go version:       go1.23.2
  platform:         linux/amd64
  tags:             netgo,builtinassets,stringlabels
配置prometheus
- 在启动
prometheus之前,我们需要准备一个prometheus的配置文件,监控目标服务。由于prometheus服务本身对外暴露了metrics指标接口,所以我们可以配置prometheus监控自身,保存一个名为prometheus.yml的文件,替换掉默认的配置文件。
cp prometheus.yml prometheus.yml_bak

cat /etc/prometheus/prometheus.yml
# 全局定义
global:
  # 设置抓取指标数据的间隔,默认为15秒
  scrape_interval: 15s

# 抓取指定的目标
scrape_configs:
  # 定义一个抓取任务
  - job_name: "prometheus"
    # 指定从监控目标暴露的http端点路径抓取指标,默认为/metrics
    metrics_path: "/metrics"
    # 配置静态目标地址,将定期从如下这些地址抓取指标
    static_configs:
- targets: ["x.x.x.x:9090"]- 可以直接通过命令启动,但直接这么启动不是很方便,因此我们可以准备一个专属的启动文件
/etc/prometheus/prometheus --config.file=/etc/prometheus/prometheus.yml
启动prometheus
- 配置
system管理prometheus启动和停止
cat /usr/lib/systemd/system/prometheus.service
[Unit]
Description=Prometheus server
Documentation=https://prometheus.io/

[Service]
User=root
Restart=always
ExecStart=/etc/prometheus/prometheus \
  --config.file=/etc/prometheus/prometheus.yml \
  --storage.tsdb.path=/prometheus/data \
  --storage.tsdb.retention.time=60d \
  --web.enable-lifecycle
ExecReload=/bin/kill -HUP $MAINPID
Restart=on-failure
RestartSec=20
TimeoutStopSec=20
SendSIGKILL=no
LimitNOFILE=8192

[Install]
WantedBy=multi-user.target-
在启动
prometheus服务时通过参数传递了一些配置选项,它们定义了prometheus服务的一些关键行为。--config.file=/etc/prometheus/prometheus.yml # 指定 Prometheus 的配置⽂件路径。 --storage.tsdb.path=/prometheus/data # 设置 Prometheus 存储时间序列数据库(TSDB)的路径。 ⽤于存放Prometheus抓取到的指标数据。 --storage.tsdb.retention.time=60d # 配置 Prometheus 的数据保留期限。超过这个时间范围的旧数据将被删除。这个可以根据存储资源和监控需求进⾏调整。 --web.enable-lifecycle # 允许通过 HTTP 请求的⽅式来更新Prometheus的配置。 # 更新命令如下: curl -X POST http://localhost:9090/-/reload -
启动
prometheus服务
systemctl daemon-reload
systemctl start prometheus.service
netstat -lntp | grep 9090
tcp6       0      0 :::9090                 :::*                    LISTEN      20056/prometheus
访问prometheus
- 通过访问对应服务的
IP:9090端口,访问prometheus的UI界面
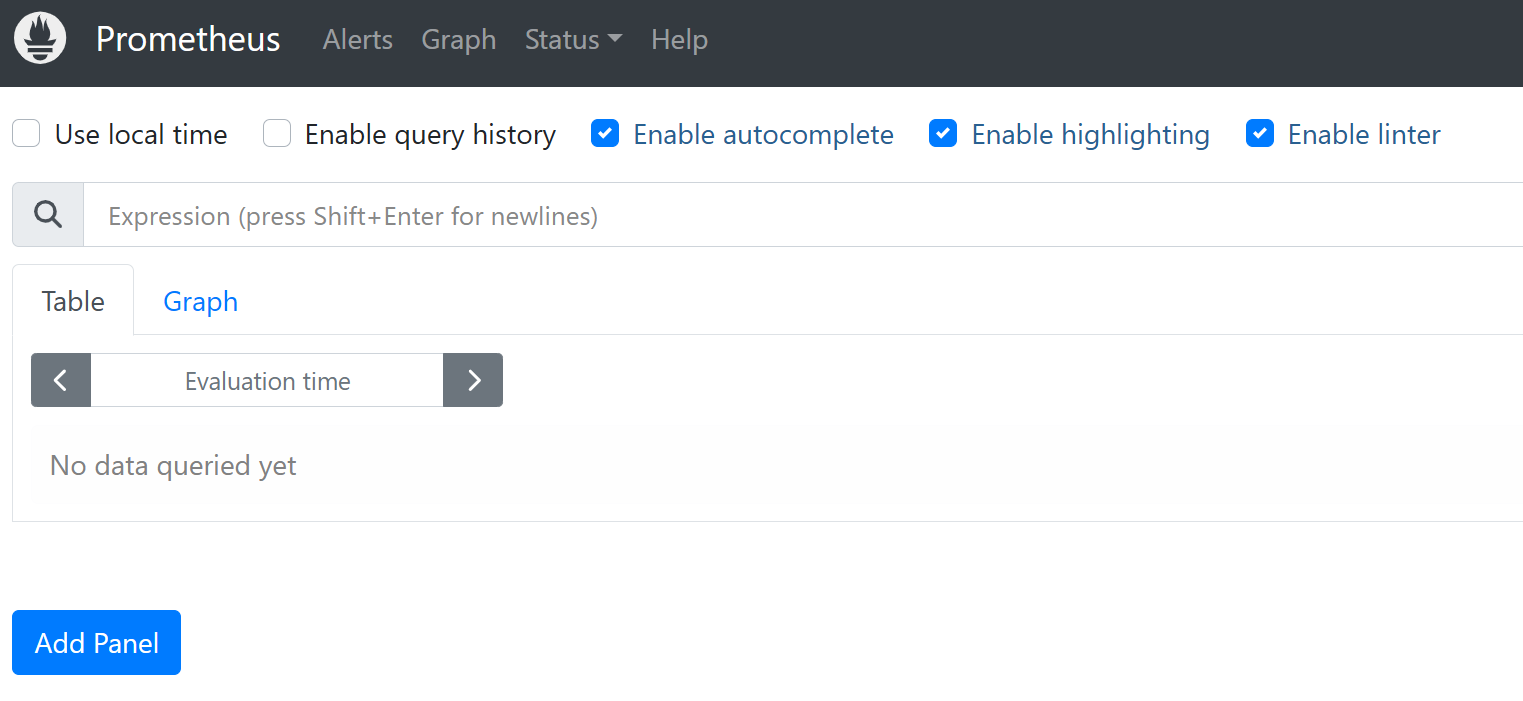
prometheus的WebUI
prometheus的web ui提供了多个页面,以便用户可以查询指标、查看配置和状态,以及管理告警等。以下是prometheus webui中常见的几个页面及其描述:
graph:允许用户通过prometheus的查询语言PromQL来查询数据,并将结果以图形的形式展示。alert:允许用户查看当前配置的告警规则以及每个告警的状态。status:页面包含了几个子页面,它们提供了关于prometheus服务器本身的各种信息:command-line flags:显示了prometheus启动时使用的命令行参数。这有助于了解prometheus的配置和运行状态。configuration:展示了prometheus当前加载的配置文件内容,可以用了确认prometheus正在使用的配置,有助于调试问题。target:显示了prometheus监控的采集目标列表,包括每个目标的健康状态。如果某个指标无法抓取,这里也会显示相关的错误信息。rules:显示所有配置的告警和记录规则。service discovery:展示了prometheus的服务发现状态,这包括了prometheus如何发现抓取目标,以及它们的当前状态和元数据信息。
安装grafana图形展示
grafana介绍
grafana是一款开源的数据分析和可视化工具,从2.5.0版本开始,grafana已经内置了对prometheus的支持,可以直接将prometheus作为数据源进行查询和展示
grafana安装
- 访问
grafana官网https://grafana.com/grafana/download,下载grafana
wget https://dl.grafana.com/enterprise/release/grafana-enterprise-11.3.0-1.x86_64.rpm
yum localinstall grafana-enterprise-11.3.0-1.x86_64.rpm
systemctl enable grafana-server.service
systemctl start grafana-server.service-
访问
grafana,通过http://ip:3000,默认grafana用户名为admin,密码为admin -
点击左边菜单选择:管理-->概况-->默认首选项,选择语言选择中文(简体),然后保存。
配置grafana数据源
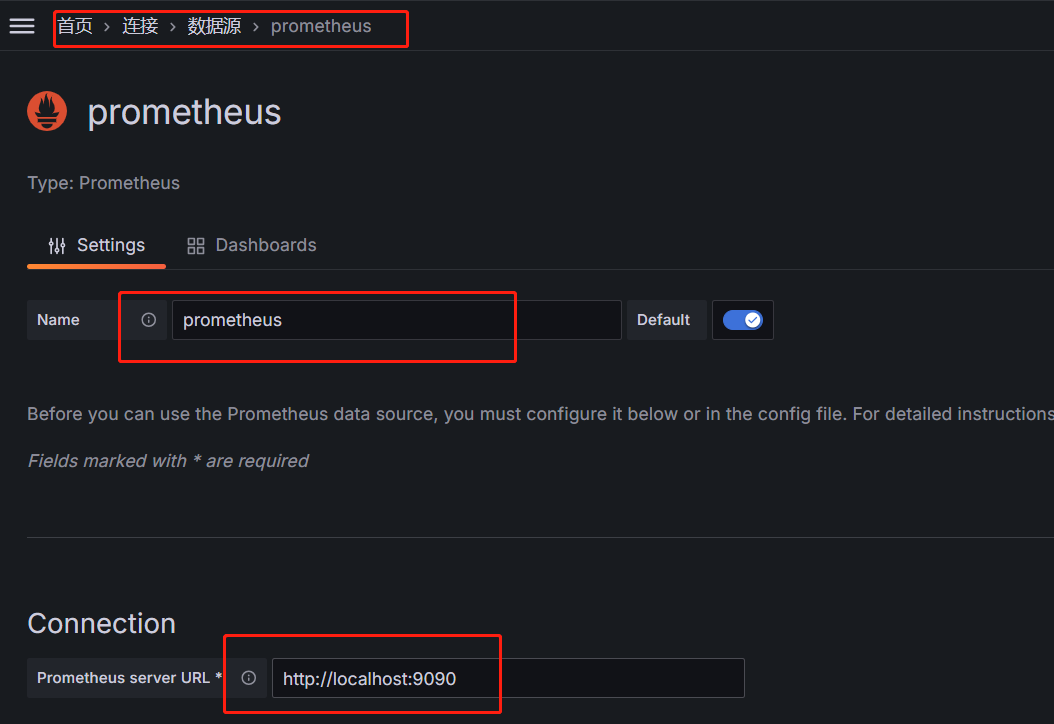
- 配置
grafana数据源为prometheus,点击菜单,连接-->数据源-->添加新数据源,选择prometheus
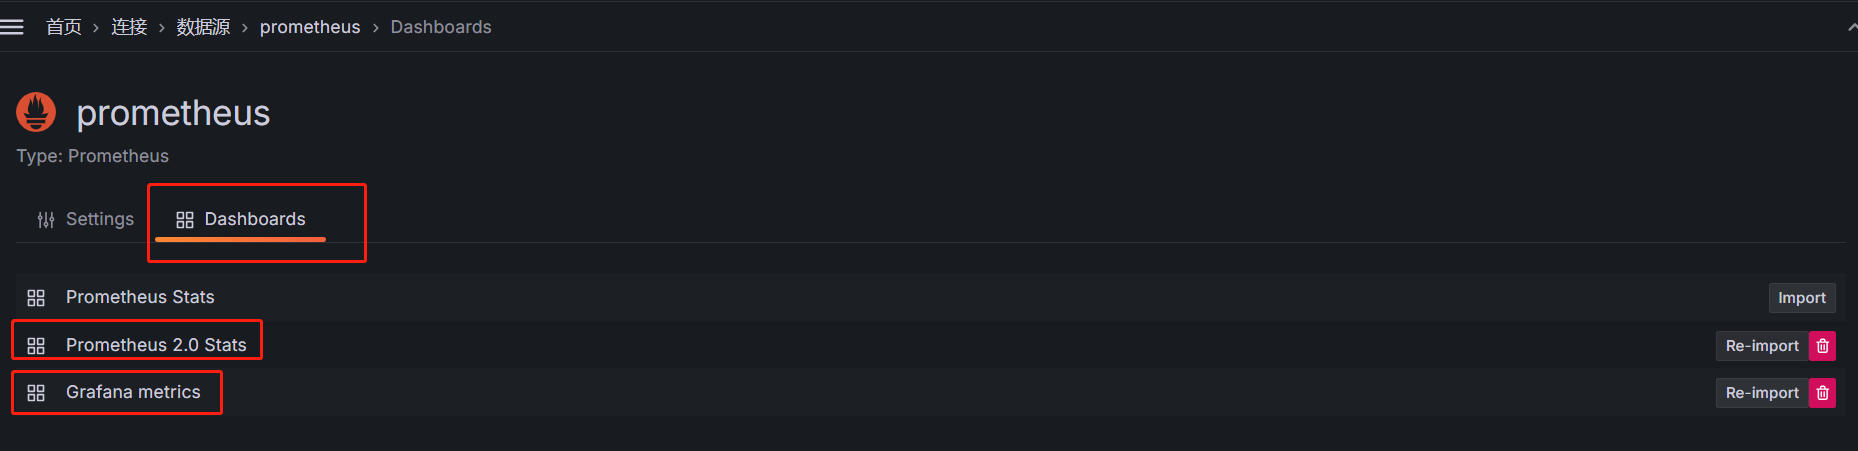
- 导入
grafana默认监控prometheus的dashboards,该dashboard主要用于监控prometheus服务器本身的性能和状态指标。
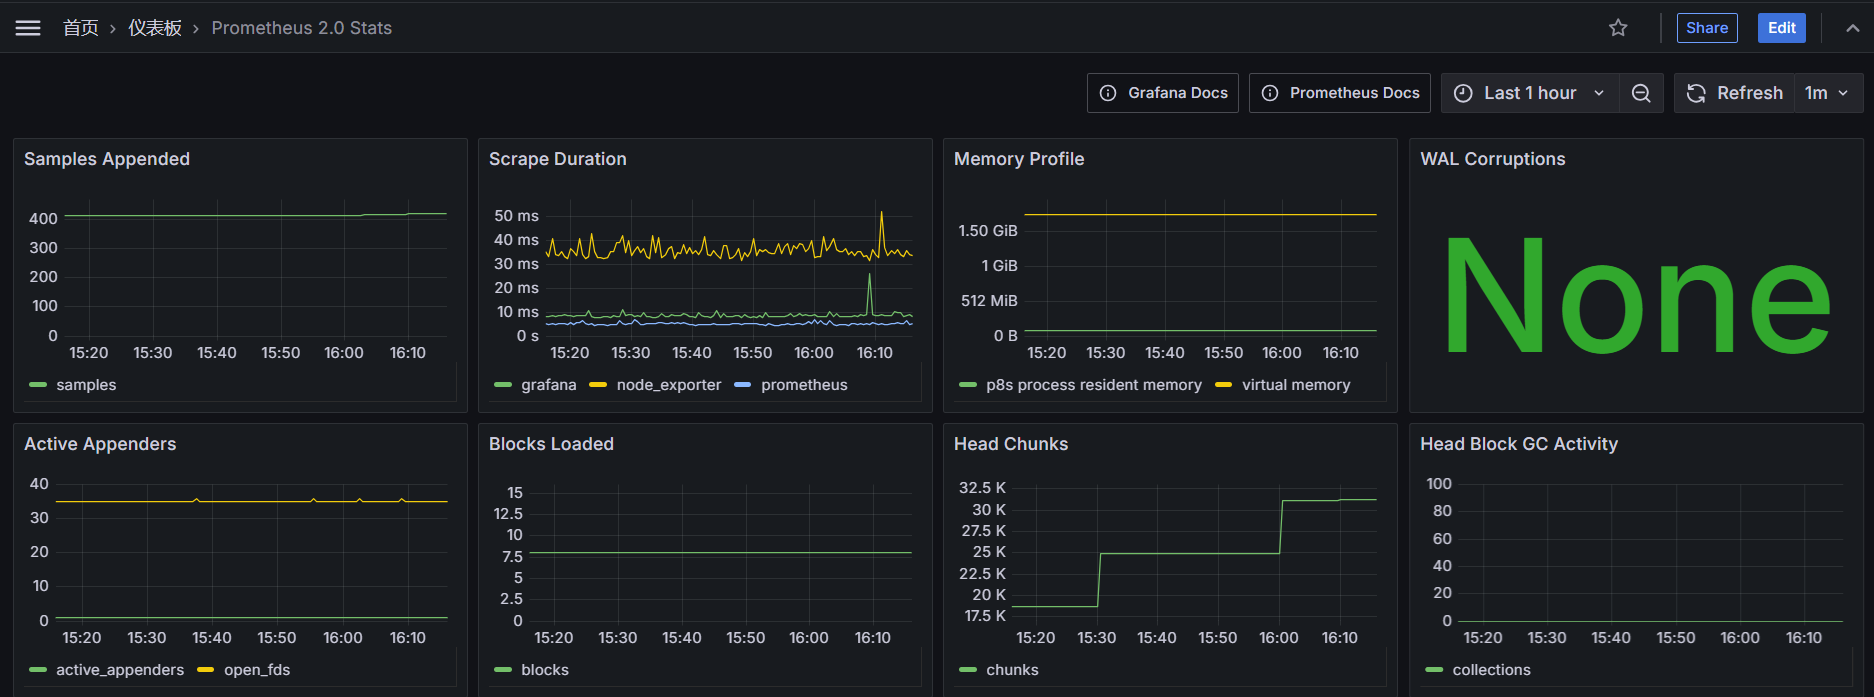
- 通过图形界面展示
prometheus的数据指标,仪表板-->Prometheus 2.0 Stats
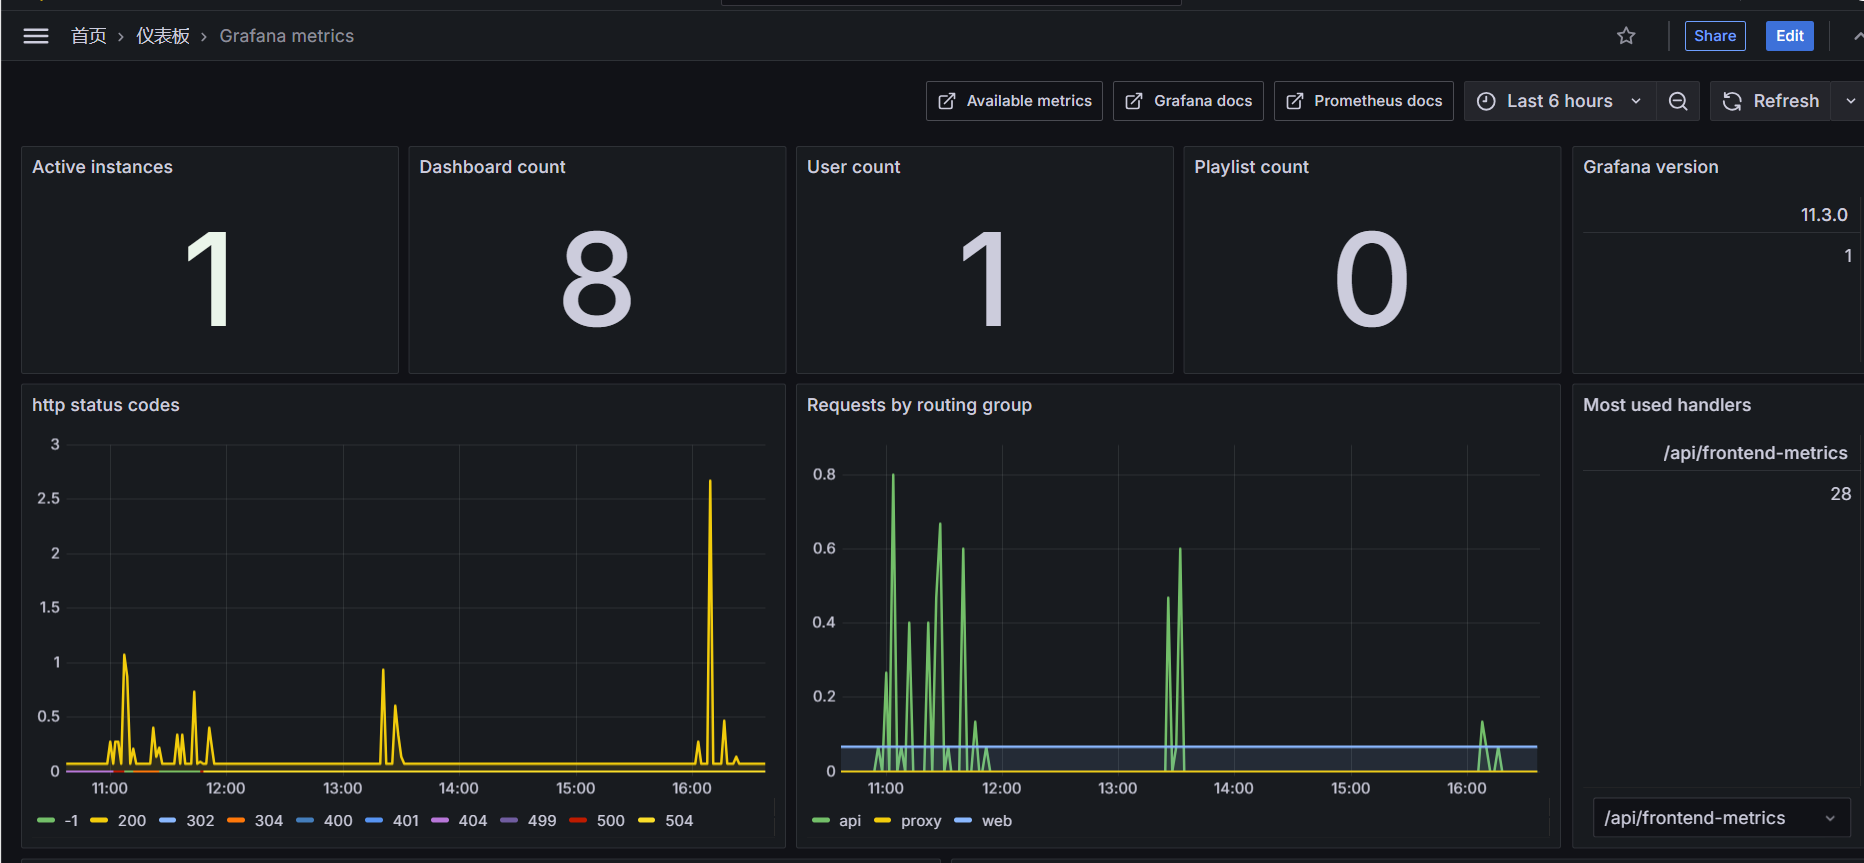
配置prometheus监控grafana
grafana作为一个广泛使用的可视化工具,其实也需要被监控。
幸运的是grafana本身提供了一个内置的指标端点。
通过访问http://grafana.dot.com:3000/metrics,你可以获取到grafana的性能指标。
这些指标包括了http请求统计、内存使用情况、图形的数量,活跃用户数指标,它们对于监控grafana的健康状况非常有帮助。
- 访问
grafana对外暴露指标的metrics接口,如果没有问题,会看到一系列的指标数据。
curl -s http://192.168.99.51:3000/metrics | tail -10
# TYPE prometheus_template_text_expansions_total counter
prometheus_template_text_expansions_total 0
# HELP promhttp_metric_handler_requests_in_flight Current number of scrapes being served.
# TYPE promhttp_metric_handler_requests_in_flight gauge
promhttp_metric_handler_requests_in_flight 0
# HELP promhttp_metric_handler_requests_total Total number of scrapes by HTTP status code.
# TYPE promhttp_metric_handler_requests_total counter
promhttp_metric_handler_requests_total{code="200"} 0
promhttp_metric_handler_requests_total{code="500"} 0
promhttp_metric_handler_requests_total{code="503"} 0- 配置
prometheus,将grafana作为一个监控目标(target)添加到配置中。
cat /etc/prometheus/prometheus.yml
scrape_configs:
  - job_name: "grafana"
    metrics_path: "/metrics"
    static_configs:
- targets: ["192.168.99.51:3000"]- 访问
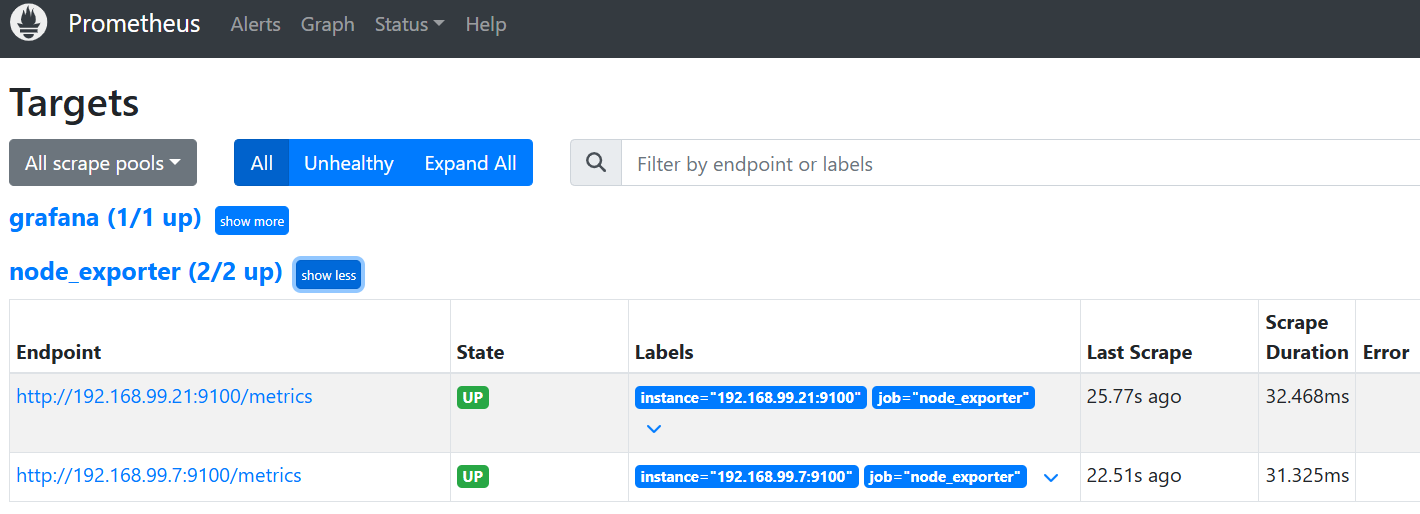
prometheus,在status中的targets界面,能看到新添加的grafana目标;如果state显示up,说明prometheus可以从grafana抓取指标。

- 接下来可以在
prometheus使用之前导入的grafana模板,这样就可以直观地展示被监控的grafana服务状态;
配置prometheus监控node节点
如何监控node节点
监控节点(如服务器或者虚拟机)通常涉及收集硬件和操作系统层面的指标,比如cpu使用率、内存占用、磁盘i/o、网络流量等。
但是这些指标并不能直接被prometheus抓取,因此我们需要借助node exporter将对应的指标转为prometheus能够兼容的指标格式,并对外提供http接口暴露给prometheus进行指标抓取。
安装node_exporter
- 访问
node_exporter的github获取node_exporter的下载地址
# 加速地址
wget https://mirror.ghproxy.com/https://github.com/prometheus/node_exporter/releases/download/v1.8.2/node_exporter-1.8.2.linux-amd64.tar.gz- 解压
node_exporter
tar xf node_exporter-1.8.2.linux-amd64.tar.gz -C /etc
ln -s /etc/node_exporter-1.8.2.linux-amd64/ /etc/node_exporter
配置node_exporter
启动node exporter即可开始进行指标采集,它默认启用了一些常见的收集器来监控cpu、内存、网络等关键指标。
然而,由于每个操作系统对收集器的支持程度不同,node_exporter也提供了一些默认未启用的收集器。我们可以根据监控需求,通过特定的参数来启用这些收集器。
- 要禁用默认激活的收集器,可以使用参数
--no-collector.<name> - 要启用默认未激活的收集器,可以使用参数
--collector.<name>
如果只想启动某些特定的收集器,可以使用--collector.disable-defaults标志禁用所有默认的,然后再指定具体要启用的收集器--collector.<name>来进行收集
默认关闭一些收集器的原因在于,有些指标采集需要占用过多资源开销,所以谨慎开启。
- 例如,禁止默认启动的
arp采集
# 直接启动会发现有arp采集
/etc/node_exporter/node_exporter

# 禁用arp收集器,就看不到了
/etc/node_exporter/node_exporter --no-collector.arp- 启用默认未激活的
tcpstat收集器
# 直接启动默认不会收集tcpstat
/etc/node_exporter/node_exporter

# 启用tcpstat
/etc/node_exporter/node_exporter --collector.tcpstat- 也可以禁用所有收集器,仅启用那些只想启用的收集器
/etc/node_exporter/node_exporter --collector.disabledefaults --collector.cpu --collector.meminfo --collector.diskstats --collec tor.netstat
启动node_exporter
- 配置
system管理node_exporter启动和停止
cat /usr/lib/systemd/system/node_exporter.service
[Unit]
Description=node_exporter
Documentation=https://prometheus.io/
After=network.target
[Service]
ExecStart=/etc/node_exporter/node_exporter \
--web.listen-address=:9100 \
--web.max-requests=40 \
--collector.mountstats \
--collector.systemd \
--collector.ethtool \
--collector.tcpstat
ExecReload=/bin/kill -HUP
TimeoutStopSec=20s
Restart=always
[Install]
WantedBy=multi-user.target- 启动node_exporter
systemctl daemon-reload
systemctl enable node_exporter.service
systemctl start node_exporter.service- 检查监听的端口
 netstat -lntp
Active Internet connections (only servers)
Proto Recv-Q Send-Q Local Address           Foreign Address         State       PID/Program name
tcp6 0 0 :::9100 :::* LISTEN 103097/node_exporte- 访问对应的
metrics,验证是否能采集到数据
curl -s localhost:9100/metrics | tail
promhttp_metric_handler_errors_total{cause="encoding"} 0
promhttp_metric_handler_errors_total{cause="gathering"} 0
# HELP promhttp_metric_handler_requests_in_flight Current number of scrapes being served.
# TYPE promhttp_metric_handler_requests_in_flight gauge
promhttp_metric_handler_requests_in_flight 1
# HELP promhttp_metric_handler_requests_total Total number of scrapes by HTTP status code.
# TYPE promhttp_metric_handler_requests_total counter
promhttp_metric_handler_requests_total{code="200"} 8622
promhttp_metric_handler_requests_total{code="500"} 0
promhttp_metric_handler_requests_total{code="503"} 0
配置prometheus
- 修改
prometheus配置,添加新的job分组,然后将对应的节点纳入监控中
cat /etc/prometheus/prometheus.yml
scrape_configs:
  - job_name: "node_exporter"
    metrics_path: "/metrics"
    static_configs:
- targets: ["192.168.99.7:9100","192.168.99.21:9100"]- 重新加载
prometheus
curl -v -X POST http://localhost:9090/-/reload
* About to connect() to localhost port 9090 (#0)
*   Trying ::1...
* Connected to localhost (::1) port 9090 (#0)
> POST /-/reload HTTP/1.1
> User-Agent: curl/7.29.0
> Host: localhost:9090
> Accept: */*
>
< HTTP/1.1 200 OK
< Date: Sun, 03 Nov 2024 01:21:18 GMT
< Content-Length: 0
<
* Connection #0 to host localhost left intact- 检查
prometheus是否已将对应节点纳入监控(点击status-->targets)
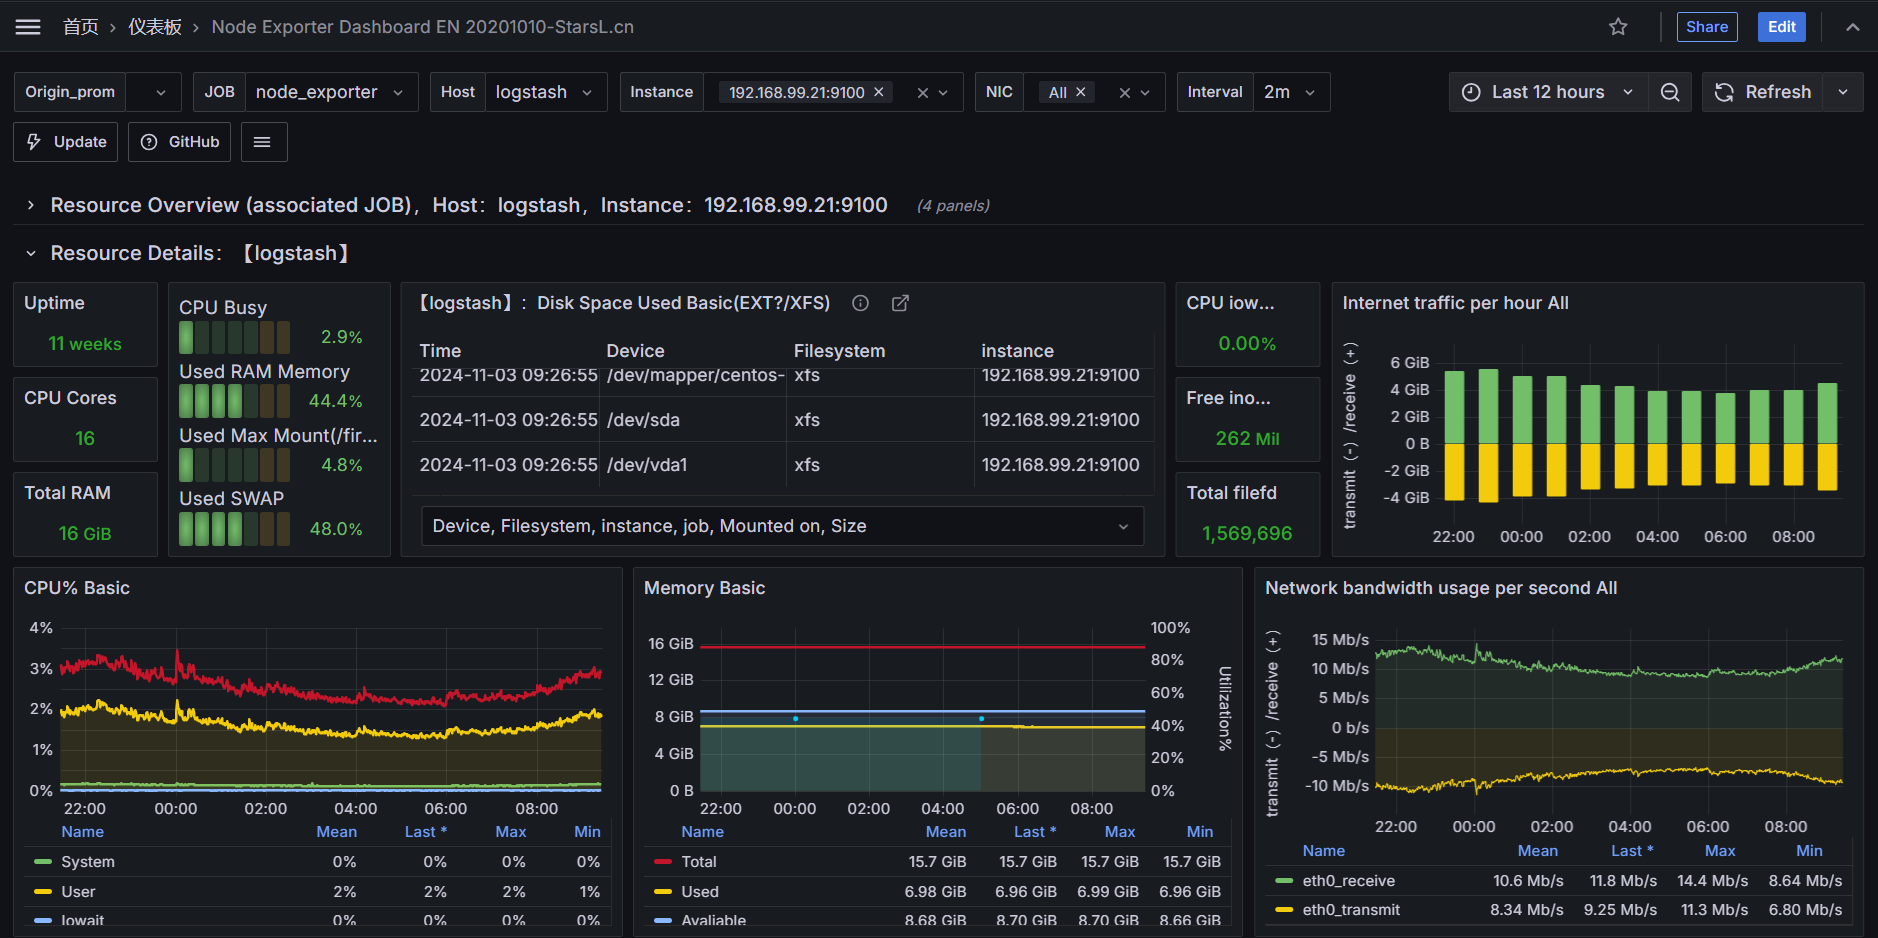
导入grafana模板
在grafana的官方插件库中,有很多node_exporter模板。
其中相对受欢迎的模板的ID是:11074、1860
- 11074:模板包括了
CPU、内存、磁盘、网络、温度传感器等指标(常用) - 1860:模板包括了
CPU、内存、磁盘、网络等。根据运行状况,及时发现潜在问题并进行调优。
node_exporter常用指标
cpu与内存相关指标
cpu负载相关核心指标
| 指标名称 | 指标类型 | 指标含义 |
|---|---|---|
| node_load1 | gauge | 过去1分钟的系统平均负载 |
| node_load5 | gauge | 过去5分钟的系统平均负载 |
| node_load15 | gauge | 过去15分钟的系统平均负载 |
cpu使用相关核心指标
| 指标名称 | 指标类型 | 指标含义 |
|---|---|---|
| node_cpu_seconds_total | counter | cpu在不同模式下使用的时间(以秒为单位) |
- 内存相关核心指标
| 指标名称 | 指标类型 | 指标含义 |
|---|---|---|
| node_memory_MemTotal_bytes | gauge | 系统总内存量(以字节为单位) |
| node_memory_MemAvailable_bytes | gauge | 系统当前可用的内存量(以字节为单位) |
| node_memory_Cached_bytes | gauge | 系统缓存使用的内存(以字节为单位) |
| node_memory_Cached_bytes | gauge | 系统缓冲使用的内存(以字节为单位) |
计算可用内存百分比:node_memory_MemAvailable_bytes/node_memory_MemTotal_bytes*100
计算已用内存百分比:
(node_memory_MemTotal_bytes-node_memory_MemAvailable_bytes)/node_memory_MemTotal_bytes*100
swap相关核心指标
| 指标名称 | 指标类型 | 指标含义 |
|---|---|---|
| node_memory_SwapTotal_bytes | gauge | 系统交换空间总量(以字节为单位) |
| node_memory_SwapFree_bytes | gauge | 系统未被使用的交换空间(以字节为单位) |
磁盘与网络相关指标
- 磁盘空间相关核心指标
| 指标名称 | 指标类型 | 指标含义 |
|---|---|---|
| node_filesystem_size_bytes | gauge | 文件系统大小(以字节为单位) |
| node_filesystem_avail_bytes | gauge | 文件系统可用空间(以字节为单位) |
计算可用空间百分比:node_filesystem_avail_bytes/node_filesystem_size_bytes*100
计算已用空间百分比:(node_filesystem_size_bytes-node_filesystem_avail_bytes)/node_filesystem_size_bytes*100
- 磁盘
inode相关核心指标
| 指标名称 | 指标类型 | 指标含义 |
|---|---|---|
| node_filesystem_files | gauge | 文件系统中inode能使用的总数 |
| node_filesystem_files_free | gauge | 文件系统中空虚inode 的数量 |
计算已用的inode百分比:(node_filesystem_files-node_filesystem_files_free)/node_filesystem_files*100
- 磁盘
i/o吞吐量相关核心指标
| 指标名称 | 指标类型 | 指标含义 |
|---|---|---|
| node_disk_read_bytes_total | counter | 从给定设备读取的总字节数。(以字节为单位)(使用irate可以得到每秒读取大小) |
| node_disk_written_bytes_total | counter | 向给定设备写入的总字节数。(以字节为单位)(使用irate可以得到每秒写入大小) |
- 磁盘
iops相关核心指标
| 指标名称 | 指标类型 | 指标含义 |
|---|---|---|
| node_disk_reads_completed_total | counter | 磁盘设备完成的读操作总数。(使用irate可以得到每秒读操作的平均数) |
| node_disk_writes_completed_total | counter | 磁盘设备完成的写操作总数。(使用irate可以得到每秒写操作的平均数) |
- 网络核心指标
| 指标名称 | 指标类型 | 指标含义 |
|---|---|---|
| node_network_receive_bytes_total | counter | 网络接口接收到的总字节数(以字节为单位) |
| node_network_transmit_bytes_total | counter | 网络接口发送出去的总字节数(以字节为单位) |
- 连接追踪核心指标
| 指标名称 | 指标类型 | 指标含义 |
|---|---|---|
| node_nf_conntrack_entries | guage | 系统正在跟踪的网络连接的数量。这包括所有类型的连接tcp、udp、icmp等 |
| node_nf_conntrack_entries_limit | guage | 系统conntrack能够跟踪的网络连接的最大数量。读取的是/proc/sys/net/netfilter/nf_conntrack_max,内核参数为:net.netfilter.nf_conntrack_max |
计算连接追踪使用百分比:node_nf_conntrack_entries/node_nf_conntrack_entries_limit*100
tcp与其他相关指标
tcp相关核心指标
| 指标名称 | 指标类型 | 指标含义 |
|---|---|---|
| node_tcp_connection_states{state="time_wait"} | guage | 当前已断开的tcp连接数 |
| node_tcp_connection_states{state="establish"} | guage | 当前建立的tcp连接数 |
- 文件描述符
| 指标名称 | 指标类型 | 指标含义 |
|---|---|---|
| node_filefd_maximum | guage | 当前系统最大可用的文件描述符数量(由fs.file-max内核参数设定,具体读取的文件/proc/sys/fs/file-max) |
| node_filefd_allocated | guage | 当前系统已经分配的文件描述符的数量 |
当前文件描述符已使用百分比:node_filefd_allocated/node_filefd_maximum*100
- 系统其他指标
| 指标名称 | 指标类型 | 指标含义 |
|---|---|---|
| node_time_seconds | guage | 当前系统的时间戳 |
| node_boot_time_seconds | guage | 系统最后一次启动的时间戳 |
系统自启动以来,总共运行了多少天:(node_time_seconds-node_boot_time_seconds)/86400
留言