监控案例介绍
监控场景描述
前面已经学些了如何使用prometheus结合node_exporter来监控系统资源的cpu、内存、磁盘、网络等,同时我们还通过监控的方法论找出了不同资源的重要的指标,并编写PromQL查询表达式和告警规则。
但是,系统资源的监控只是监控的一部分。因此我们还需要关注运行在这些节点上的应用程序。
接下来,我们将深入探讨如何通过应用程序暴露的指标来直接监控它们,或者通过exporter来间接收集不同应用的指标数据。
同时我们还会逐一介绍每个应用的关键性能指标,并讲解如何利用PromQL对这些指标进行查询。此外,我们制作对应的PromQL作为告警规则,以便在系统出现异常时,能第一时间进行通知。
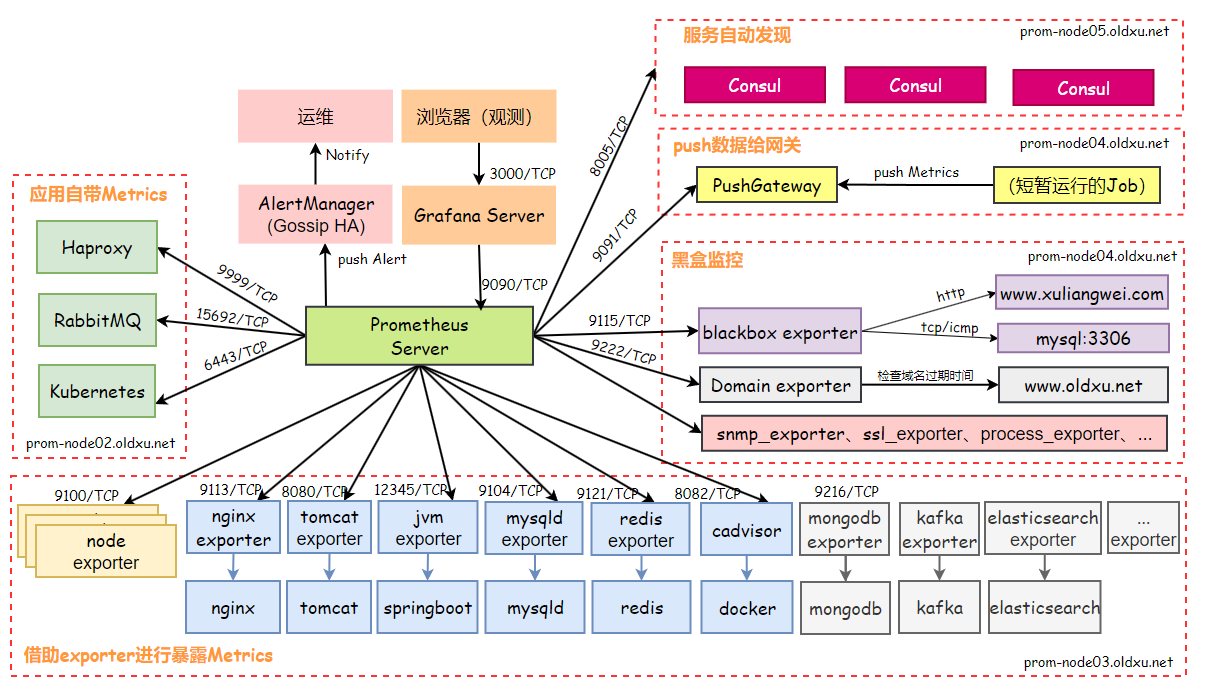
blackbox_exporter黑盒监控
blackbox_exporter介绍
blackbox_exporter是一个专门用于黑盒监控的工具,它支持多种网络协议对目标对象进行检测,比如http、https、tcp和icmp。
这意味着我们可以用它来监控网站响应状态和响应时间,以及通过端口来判断服务是否正常运行。
此外用户还可以通过设置不同的检查模块来定制blackbox_exporter,以便它能够适应不同的检测需求。
要使用blackbox_exporter监控一个服务,你只需要告诉它服务的地址和想要检查的类型。blackbox_exporter将执行检查,然后将结果存储在/probe接口中。
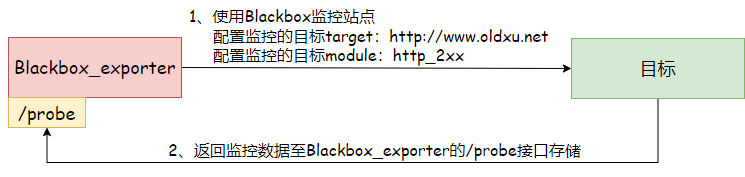
如果想要使Prometheus通过blackbox_exporter监控服务,则需要由Prometheus告诉blackbox_exporter需要监控的目标(即target),以及监控检测的方法(即module),完成设定后,prometheus就可以定期从blackbox_exporter提供的/probe端点抓取指标数据,从而对目标服务的健康状态进行分析和评估。

安装blackbox_exporter
- 访问
blackbox_exporter的github地址,https://github.com/prometheus/blackbox_exporter/releases/download/v0.25.0/blackbox_exporter-0.25.0.linux-amd64.tar.gz,下载blackbox_exporter
# 加速地址
wget https://mirror.ghproxy.com/https://github.com/prometheus/blackbox_exporter/releases/download/v0.25.0/blackbox_exporter-0.25.0.linux-amd64.tar.gz- 解压
blackbox_exporter
tar xf blackbox_exporter-0.25.0.linux-amd64.tar.gz -C /etc
ln -s /etc/blackbox_exporter-0.25.0.linux-amd64/ /etc/blackbox_exporter- 编辑
/etc/blackbox_exporter/blackbox.yml默认编辑文件,可以自定义对应的模块,
https://github.com/prometheus/blackbox_exporter/blob/master/example.yml
cat /etc/blackbox_exporter/blackbox.yml
modules:
  http_2xx:
    prober: http
    http:
      preferred_ip_protocol: "ip4"
      valid_http_versions: [ "HTTP/1.1", "HTTP/2.0" ]

  http_post_2xx:
    prober: http
    http:
      method: POST
      preferred_ip_protocol: "ip4"
      valid_http_versions: [ "HTTP/1.1", "HTTP/2.0" ]

  tcp_connect:
    prober: tcp
    timeout: 5s

  icmp:
    prober: icmp
    timeout: 5s
    icmp:
      preferred_ip_protocol: "ip4"

  dns_tcp:
    prober: dns
    dns:
      transport_protocol: "tcp"
      preferred_ip_protocol: "ip4"
      query_name: "www.blue.yn.cn"

  ssh_banner:
    prober: tcp
    tcp:
      query_response:
      - expect: "^SSH-2.0-"
- send: "SSH-2.0-blackbox-ssh-check"- 配置
blackbox_exporter启动文件
cat /usr/lib/systemd/system/blackbox_exporter.service
[Unit]
Description=blackbox_exporter
Documentation=https://prometheus.io/
After=network.target

[Service]
ExecStart=/etc/blackbox_exporter/blackbox_exporter \
        --config.file=/etc/blackbox_exporter/blackbox.yml \
        --web.listen-address=:9115
ExecReload=/bin/kill -HUP $MAINPID
TimeoutStopSec=20s
Restart=always

[Install]
WantedBy=multi-user.target- 启动
blackbox_exporter
systemctl daemon-reload
systemctl enable blackbox_exporter.service
systemctl start blackbox_exporter.service

netstat -lntp
Active Internet connections (only servers)
Proto Recv-Q Send-Q Local Address           Foreign Address         State       PID/Program name
tcp6       0      0 :::9115                 :::*                    LISTEN      26220/blackbox_expo
访问black_exporter
- 访问
blackbox_exporter,通过http://ip:9115
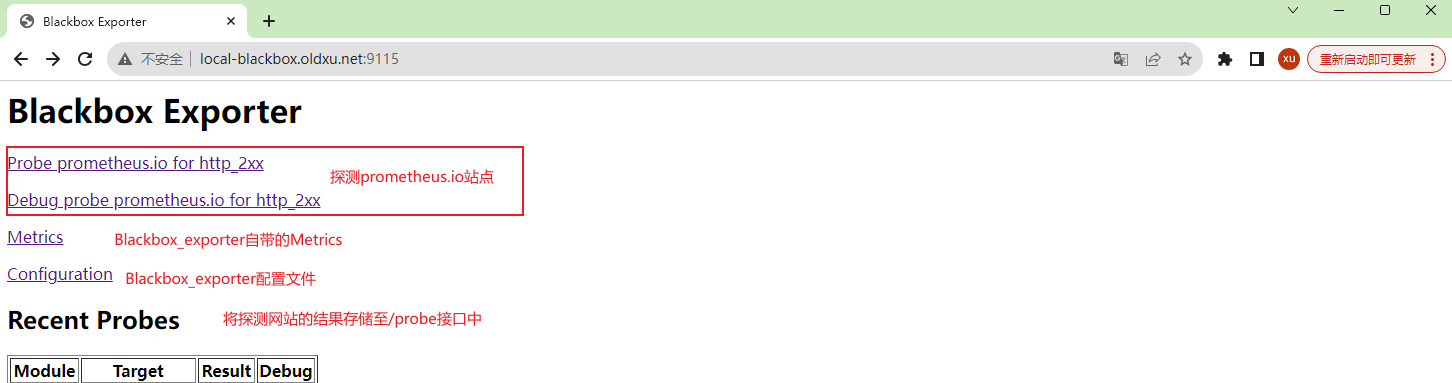
- 使用
blackbox_exporter监控站点,需要传递目标target,以及检测方法module
具体的url地址:http://prometheus.dot.com:9115/probe?target=prometheus.io&module=http_2xx&debug=true
- 针对
blackbox_exporter的探测过程进行解读
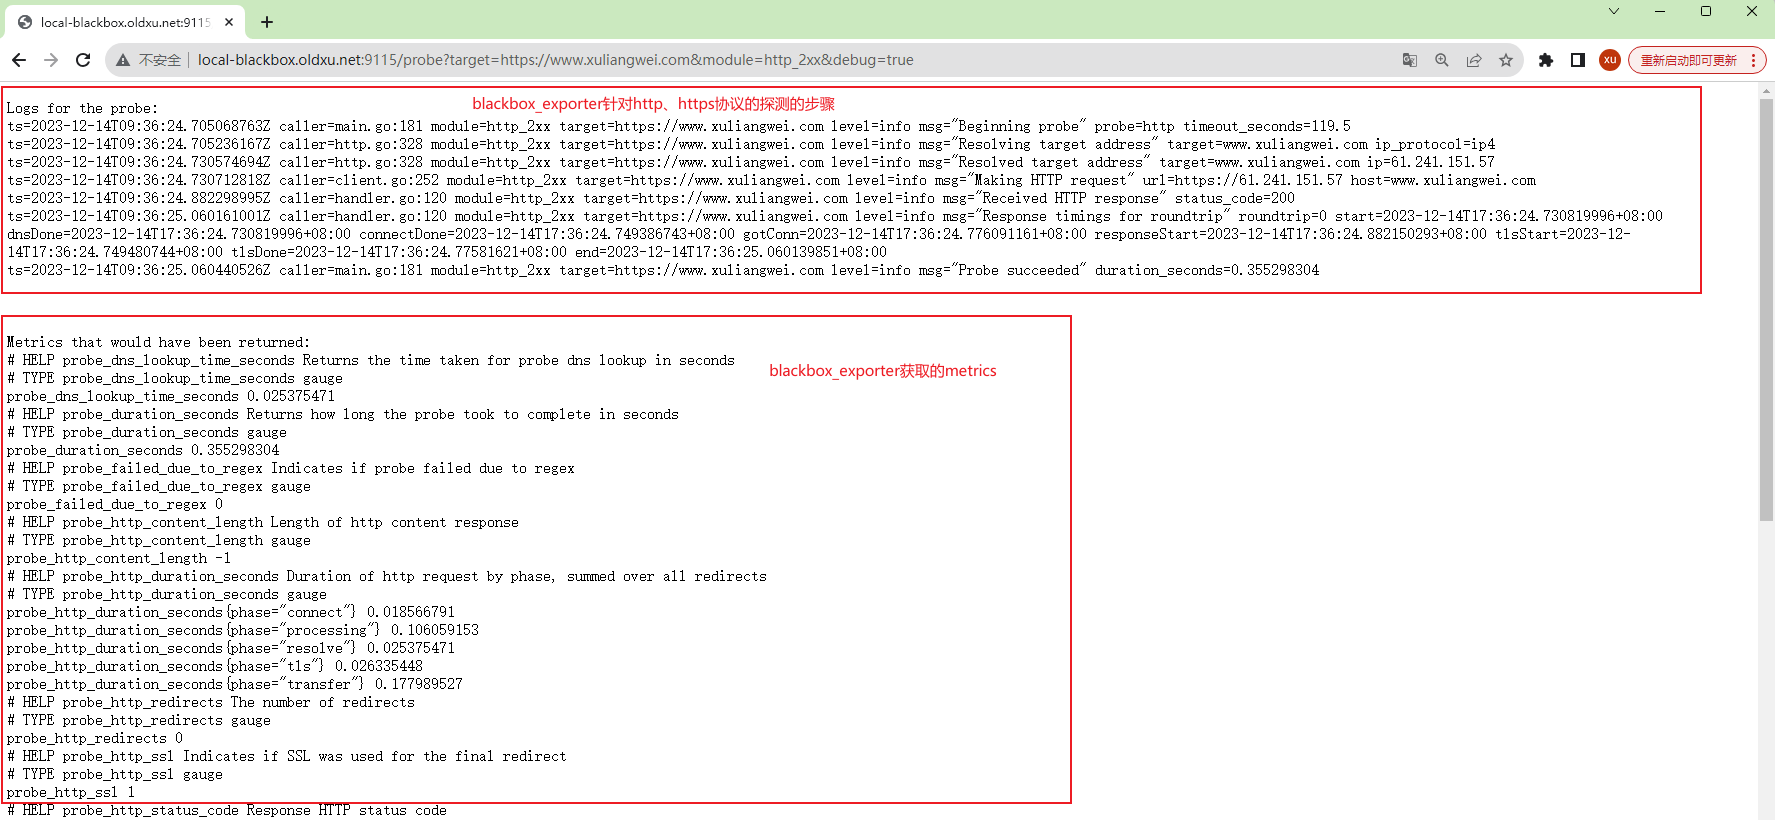
Logs for the probe:
ts=2023-12-14T09:36:24.705068763Z caller=main.go:181 module=http_2xx target=https://www.xuliangwei.com level=info msg="Beginning probe" probe=http timeout_seconds=119.5
ts=2023-12-14T09:36:24.705236167Z caller=http.go:328 module=http_2xx target=https://www.xuliangwei.com level=info msg="Resolving target address" target=www.xuliangwei.com ip_protocol=ip4
ts=2023-12-14T09:36:24.730574694Z caller=http.go:328 module=http_2xx target=https://www.xuliangwei.com level=info msg="Resolved target address" target=www.xuliangwei.com ip=61.241.151.57
ts=2023-12-14T09:36:24.730712818Z caller=client.go:252 module=http_2xx target=https://www.xuliangwei.com level=info msg="Making HTTP request" url=https://61.241.151.57 host=www.xuliangwei.com
ts=2023-12-14T09:36:24.882298995Z caller=handler.go:120 module=http_2xx target=https://www.xuliangwei.com level=info msg="Received HTTP response" status_code=200
ts=2023-12-14T09:36:25.060161001Z caller=handler.go:120 module=http_2xx target=https://www.xuliangwei.com level=info msg="Response timings for roundtrip" roundtrip=0 start=2023-12-14T17:36:24.730819996+08:00 dnsDone=2023-12-14T17:36:24.730819996+08:00 connectDone=2023-12-14T17:36:24.749386743+08:00 gotConn=2023-12-14T17:36:24.776091161+08:00 responseStart=2023-12-14T17:36:24.882150293+08:00 tlsStart=2023-12-14T17:36:24.749480744+08:00 tlsDone=2023-12-14T17:36:24.77581621+08:00 end=2023-12-14T17:36:25.060139851+08:00
ts=2023-12-14T09:36:25.060440526Z caller=main.go:181 module=http_2xx target=https://www.xuliangwei.com level=info msg="Probe succeeded" duration_seconds=0.355298304

# 1、开始探测(msg="Beginning probe") 使⽤的是 http_2xx 模块,超时设置为119.5秒。
# 2、解析⽬标地址(msg="Resolving target address") 正在尝试解析⽬标 www.xuliangwei.com 的IP地址,使⽤的是IPv4协议。
# 3、已解析⽬标地址(msg="Resolved target address") 成功解析为61.241.151.57。
# 4、发出 HTTP 请求(msg="Making HTTP request") 向 http://61.241.151.57 发出HTTP请求,请求中的 host 头设置为 www.xuliangwei.com。
# 5、收到 HTTP 响应(msg="Received HTTP response") 已收到状态码为200的HTTP响应,这意味着网页正常,服务器成功处理了请求。
# 6、响应时间(msg="Response timings for roundtrip") 提供了对于整个请求-响应周期中每个步骤的具体时间点,包括DNS解析完成、TLS握⼿开始和完成、连接建⽴、获得连接、响应开始等时间点。
# 7、探测成功(msg="Probe succeeded") 探测操作成功完成,总耗时为0.355298304秒。
配置prometheus
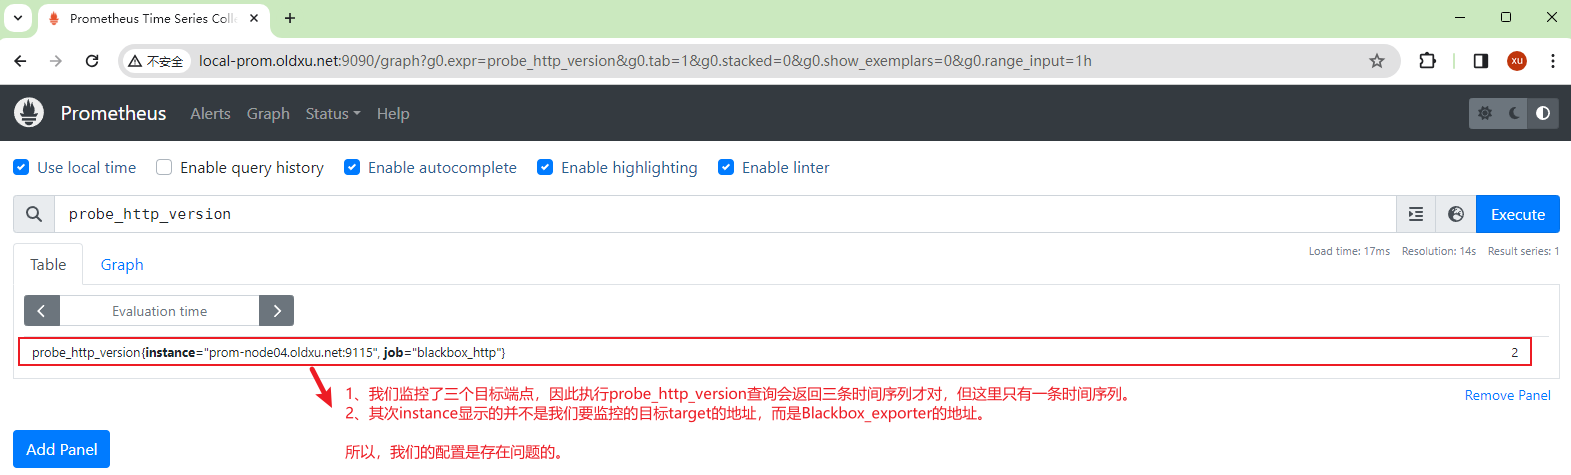
- 修改
prometheus配置,由于blackbox_exporter需要传入taget和module参数,因此采用如下方式:
vim /etc/prometheus/prometheus.yml
scrape_configs:
  - job_name: 'blackbox_http'
    metrics_path: /probe # metrics的path这次不是/metrics,⽽是/probe
    params: # 传递参数
      module: [http_2xx] # 调⽤哪个模块进⾏探测
      target: ["https://www.xuliangwei.com","http:/www.oldxu.net","https://www.baidu.com"] # 探测的站点是哪些
    static_configs:
- targets: ["prom-node04.oldxu.net:9115"]-
重新加载
prometheus配置文件
curl -X POST http://localhost:9090/-/reload -
检查
prometheus的status-->target页面,验证blackbox_exporter是否已经成功纳入监控
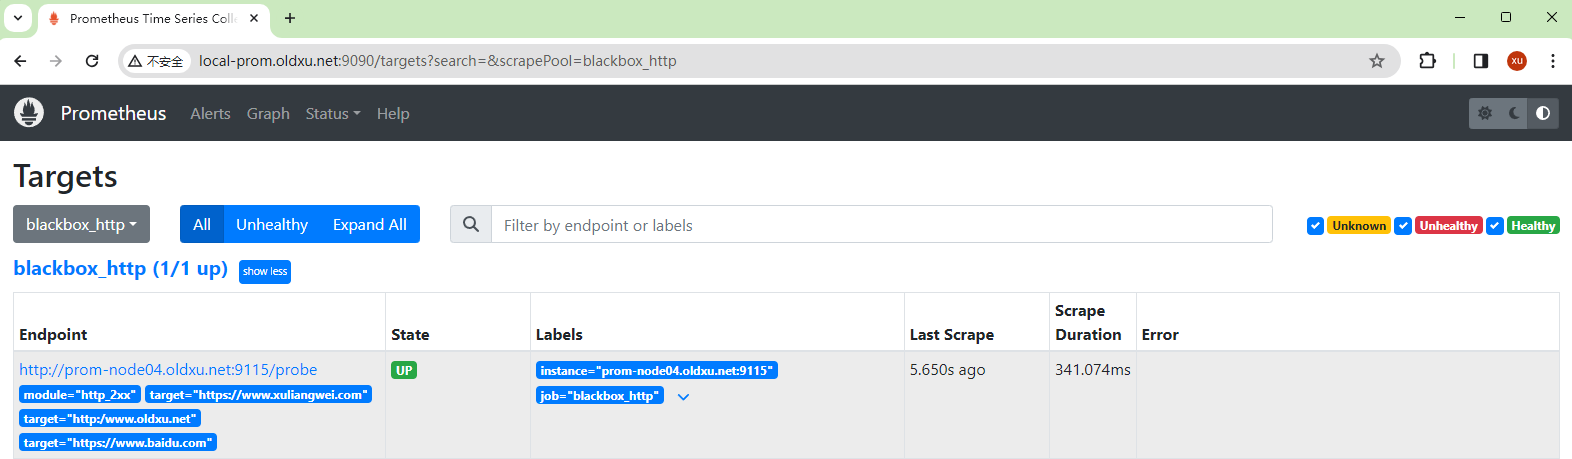
- 验证抓取的
metrics是否正确
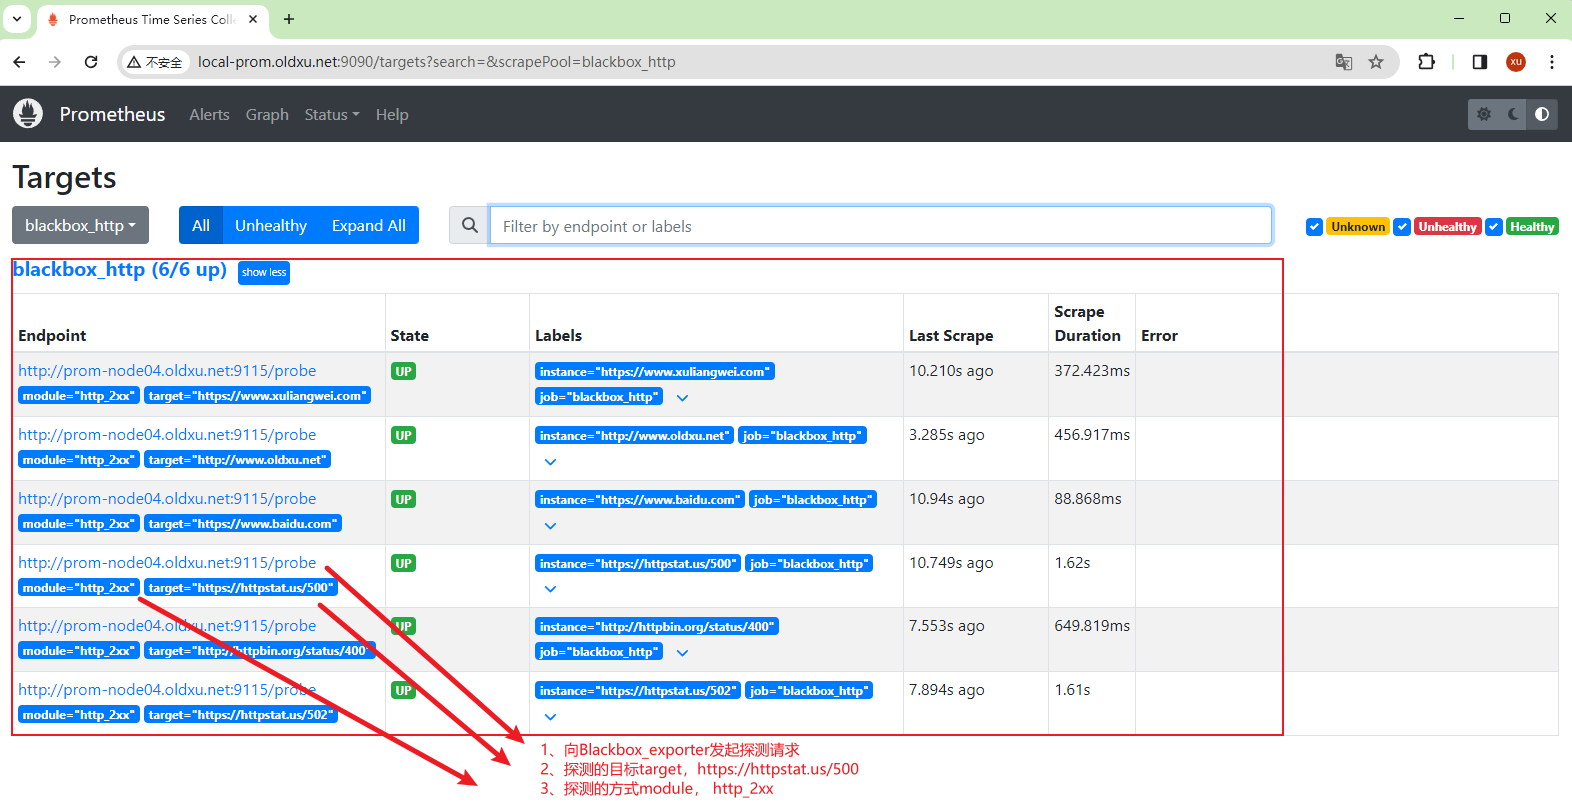
重新配置prometheus
- 修改
prometheus配置,使用relabel_configs做标签替换
cat /etc/prometheus/prometheus.yml
scrape_configs:
- job_name: "blackbox_http"
metrics_path: "/probe"
static_configs:
- targets: ["blue.yn.cn"]
params:
module: [http_2xx]
relabel_configs:
- source_labels: [__address__]
target_label: __param_target
- source_labels: [__param_target]
target_label: instance
- target_label: __address__
replacement: 192.168.99.51:9115
# relabel_configs是标签重写的配置,这⾥进⾏了三次操作:
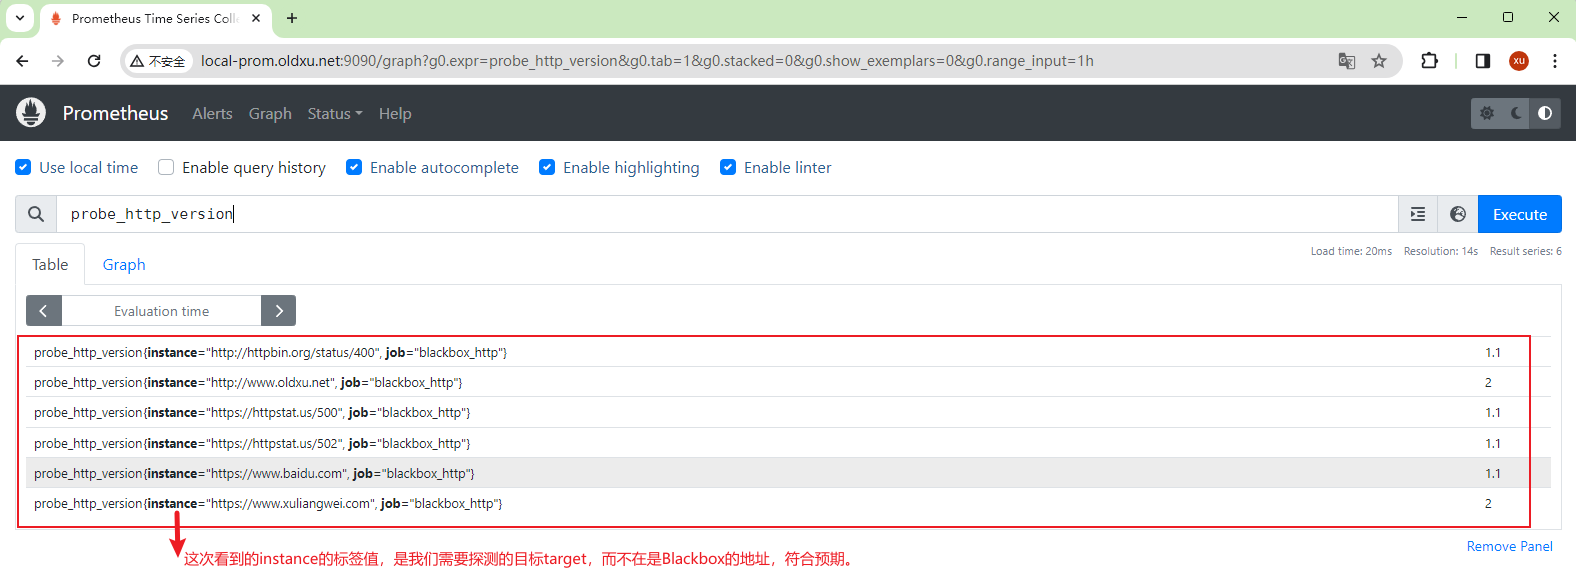
# 1、将目标地址(__address__)赋予给__param_target,这是Blackbox Exporter需要的⽬标target参数。
# 2、将__param_target的内容复制到instance标签,这样Prometheus UI中显示的instance实例名称会是目标站点地址,⽽不是Blackbox的地址。
# 3、最后,将实际发送探测请求的地址(__address__)设置为运⾏Blackbox Exporter的节点地址和端口(192.168.99.51:9115),这样Prometheus就会向这个地址发送探测请求。-
重新加载
prometheus配置文件
curl -X POST http://localhost:9090/-/reload -
检查
prometheus的status-->target页面,验证blackbox_http是否已经成功纳入监控
- 再次检查
metrics指标
配置tcp、ssh、icmp监控
- 修改
prometheus配置
cat /etc/prometheus/prometheus.yml
scrape_configs:
  - job_name: "blackbox_tcp"
    metrics_path: "/probe"
    static_configs:
    - targets: ["blue.yn.cn:873","blue.yn.cn:10050","blue.yn.cn:3306"]
    params:
      module: [tcp_connect]
    relabel_configs:
    - source_labels: [__address__]
      target_label: __param_target
    - source_labels: [__param_target]
      target_label: instance
    - target_label: __address__
      replacement: 192.168.99.51:9115

  - job_name: "blackbox_icmp"
    metrics_path: "/probe"
    static_configs:
    - targets: ["blue.yn.cn"]
    params:
      module: [icmp]
    relabel_configs:
    - source_labels: [__address__]
      target_label: __param_target
    - source_labels: [__param_target]
      target_label: instance
    - target_label: __address__
      replacement: 192.168.99.51:9115

  - job_name: "blackbox_ssh"
    metrics_path: "/probe"
    static_configs:
    - targets: ["blue.yn.cn:22"]
    params:
      module: [ssh_banner]
    relabel_configs:
    - source_labels: [__address__]
      target_label: __param_target
    - source_labels: [__param_target]
      target_label: instance
    - target_label: __address__
replacement: 192.168.99.51:9115-
重新加载
prometheus配置文件
curl -X POST http://localhost:9090/-/reload -
检查
prometheus的status-->target页面,验证blackbox_tcp、blackbox_ssh、blackbox_icmp是否已经成功纳入监控
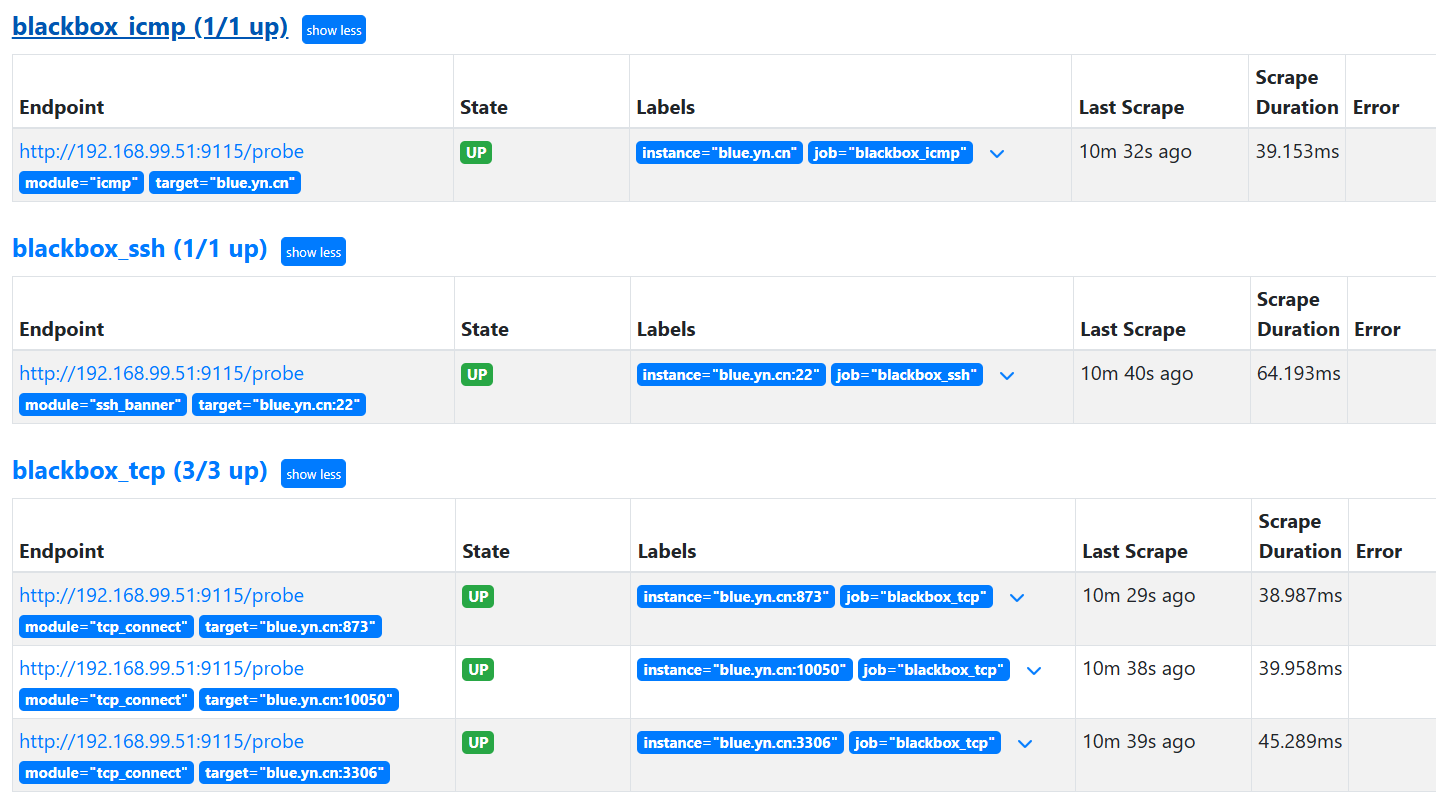
blackbox常用指标与示例
blackbox探测相关指标
| 指标名称 | 指标类型 | 指标含义 |
|---|---|---|
| probe_success | gauge | 探测目标是否成功(1表示探测测功,0表示探测失败) |
| probe_dns_lookup_time_seconds | gauge | dns查询所消耗的时间,单位秒(探测目标为域名时才有意义) |
| probe_duration_seconds | gauge | 探测目标总耗时,单位秒(包括了dns解析时间、tcp连接建立时间、发送请求以及接收响应的全部时间) |
案例1:查询blackbox探测失败的目标,以及使用的探测方式。
probe_success
案例2:查询dns解析响应时间超过500毫秒的目标
probe_dns_lookup_time_seconds > 0.500
案例3:查询最近1分钟,平均探测目标总耗时超过0.1秒的目标
avg_over_time(probe_duration_seconds[1m]) > 0.1
blackbox探测http相关指标
| 指标名称 | 指标类型 | 指标含义 |
|---|---|---|
| probe_http_version | gauge | 探测目标使用的http协议版本 |
| probe_http_ssl | gauge | 探测的请求是否通过https协议进行。1表示使用https,0表示不使用 |
| probe_http_redirects | gauge | 统计在完成http请求过程中发生的重定向次数 |
| probe_http_status_code | gauge | http响应的http状态码 |
| probe_http_duration_seconds | gauge | http记录http请求的各个阶段的持续时间。包括连接建立(connect)、域名解析(resolve)、tls握手(tls)、服务器处理(processing)以及数据传输(transfer)阶段 |
| probe_ssl_earliest_cert_expiry | gauge | ssl证书过期的时间戳。(未来时间) |
案例1:查询目标站点重定向超过5次以上
probe_http_redirects > 5
案例2:查询目标站点不同阶段耗时超过500毫秒
(
probe_http_duration_seconds{phase="resolve"} > 0.5 or
probe_http_duration_seconds{phase="connect"} > 0.5 or
probe_http_duration_seconds{phase="tls"} > 0.5 or
probe_http_duration_seconds{phase="processing"} > 0.5 or
probe_http_duration_seconds{phase="transfer"} > 0.5
)
案例3:查询目标站点响应状态码异常的,例如:小于等于199,或者大于等于400以上的
probe_http_status_code <= 199 or probe_http_status_code >= 400
案例4:计算网站证书过期时间,计算公式:(ssl过期时间-当前时间)/86400
(probe_ssl_earliset_cert_expiry - time()) / 86400
blackbox告警规则文件
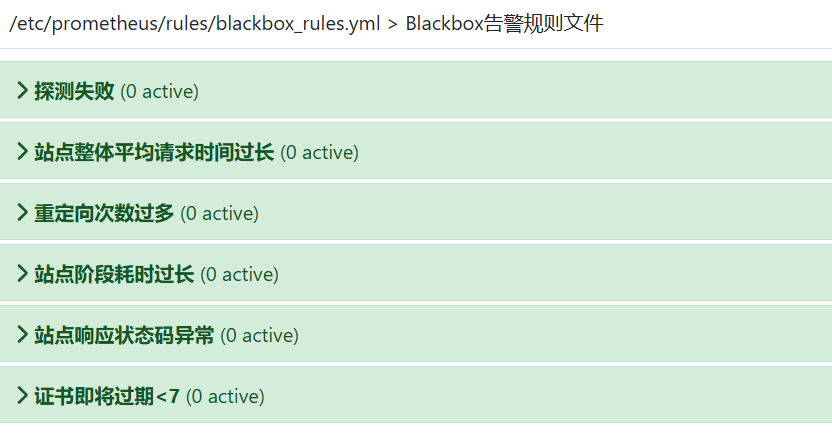
- 编写告警规则文件
cat /etc/prometheus/rules/blackbox_rules.yml
groups:
  - name: Blackbox告警规则文件
    rules:
    - alert: 探测失败
      expr: sum(probe_success == 0) by (instance, job)
      for: 5m
      labels:
        severity: critical
      annotations:
        summary: "实例 {{ $labels.instance }} 探测失败"
        description: "探测目标 {{ $labels.instance }} 在 job {{ $labels.job}} 中失败。"

    - alert: 站点整体平均请求时间过长
      expr: sum(avg_over_time(probe_http_duration_seconds[1m])) by (instance,job) > 3
      for: 1m
      labels:
        severity: warning
      annotations:
        summary: "实例 {{ $labels.instance }} 请求时间过长"
        description: "实例 {{ $labels.instance }} 最近1分钟的平均请求时间超过3秒。当前平均请求时间:{{ $value }}秒。"

    - alert: 重定向次数过多
      expr: probe_http_redirects > 5
      for: 5m
      labels:
        severity: warning
      annotations:
        summary: "实例 {{ $labels.instance }} 重定向次数过多"
        description: "实例 {{ $labels.instance }} 在最近的探测中重定向次数超过5次。当前次数:{{ $value }}次。"

    - alert: 站点阶段耗时过长
      expr:
        (
          probe_http_duration_seconds{phase="connect"} > 0.5 or
          probe_http_duration_seconds{phase="processing"} > 0.5 or
          probe_http_duration_seconds{phase="resolve"} > 0.5 or
          probe_http_duration_seconds{phase="tls"} > 0.5 or
          probe_http_duration_seconds{phase="transfer"} > 0.5
        )
      for: 1m
      labels:
        severity: warning
      annotations:
        summary: "实例 {{ $labels.instance }} 阶段 '{{ $labels.phase }}' 耗时过长"
        description: "实例 {{ $labels.instance }} 在阶段 '{{ $labels.phase}}' 的耗时超过0.5秒。当前耗时:{{ $value }}秒。                                                                 "

    - alert: 站点响应状态码异常
      expr: probe_http_status_code <= 199 or probe_http_status_code >= 400
      for: 5m
      labels:
        severity: critical
      annotations:
        summary: "实例 {{ $labels.instance }} 返回异常状态码"
        description: "实例 {{ $labels.instance }} 返回的状态码为 {{ $value }},表明请求可能存在问题。"

    - alert: 证书即将过期<7
      expr: (probe_ssl_earliest_cert_expiry - time()) /86400 < 7
      for: 24h
      labels:
        severity: critical
      annotations:
        summary: "实例 {{ $labels.instance }} 的 SSL 证书即将过期"
description: "实例 {{ $labels.instance }} 的 SSL 证书将在 {{ $value}} 天内过期。"- 检查告警规则信息
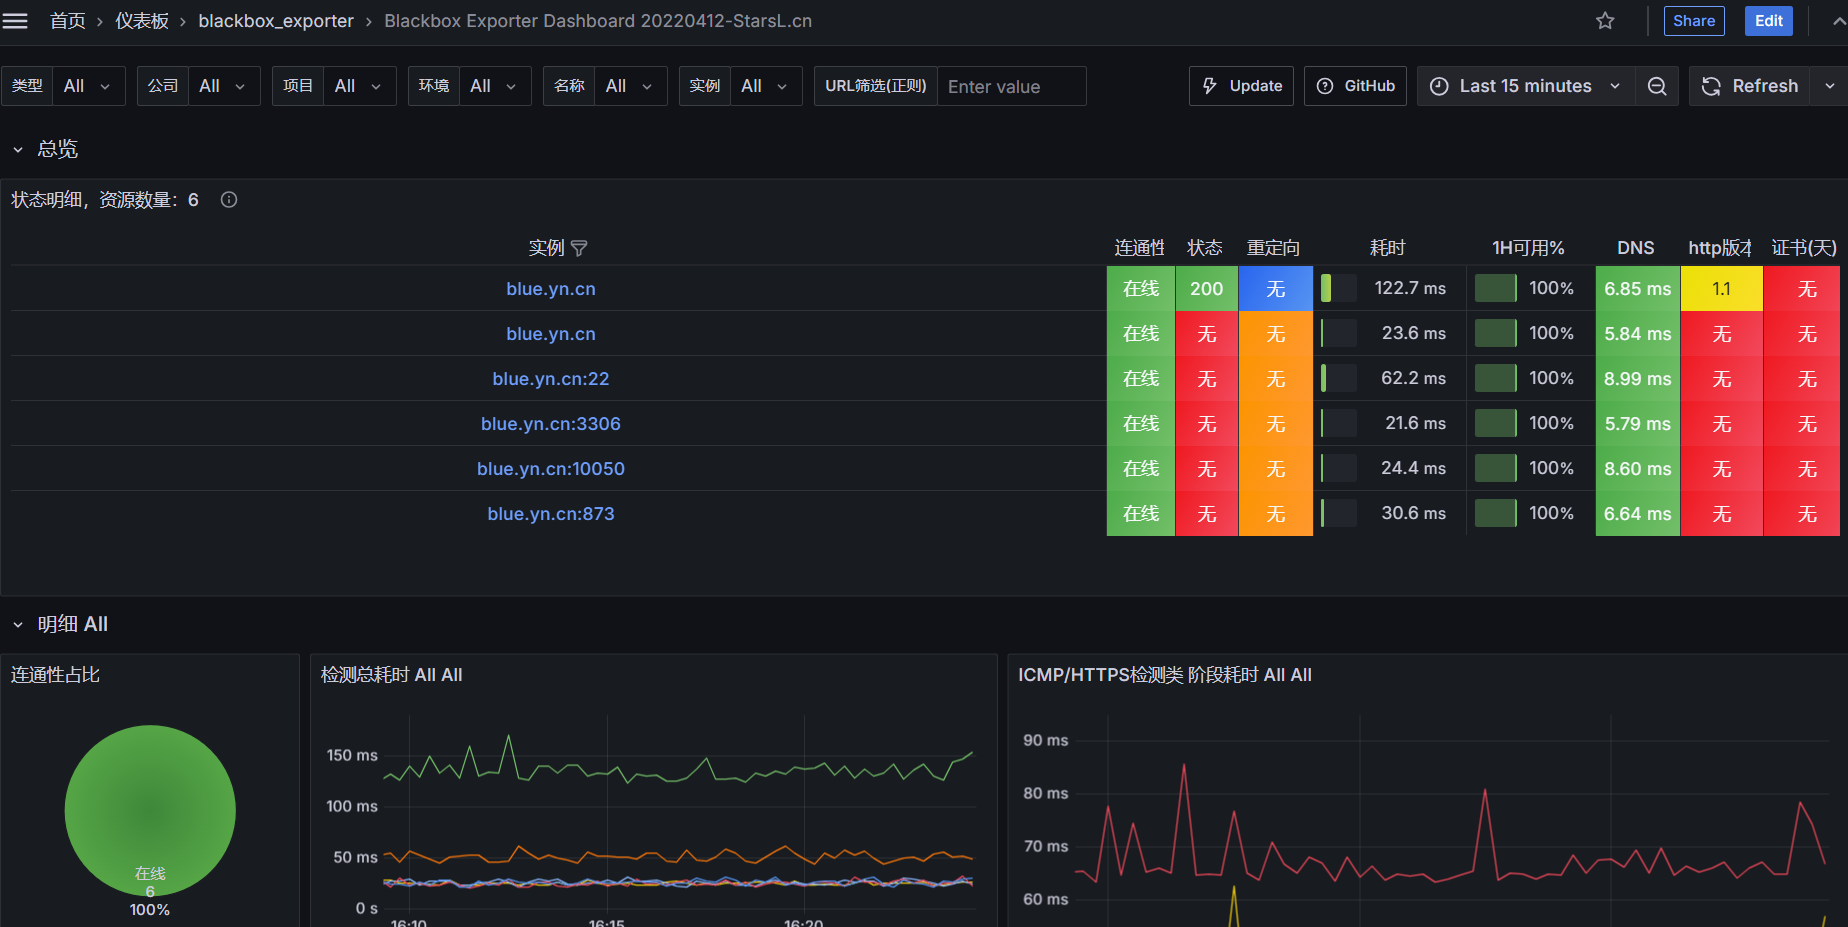
导入blackbox图形
- 专用针对
http的图形,导入id13569
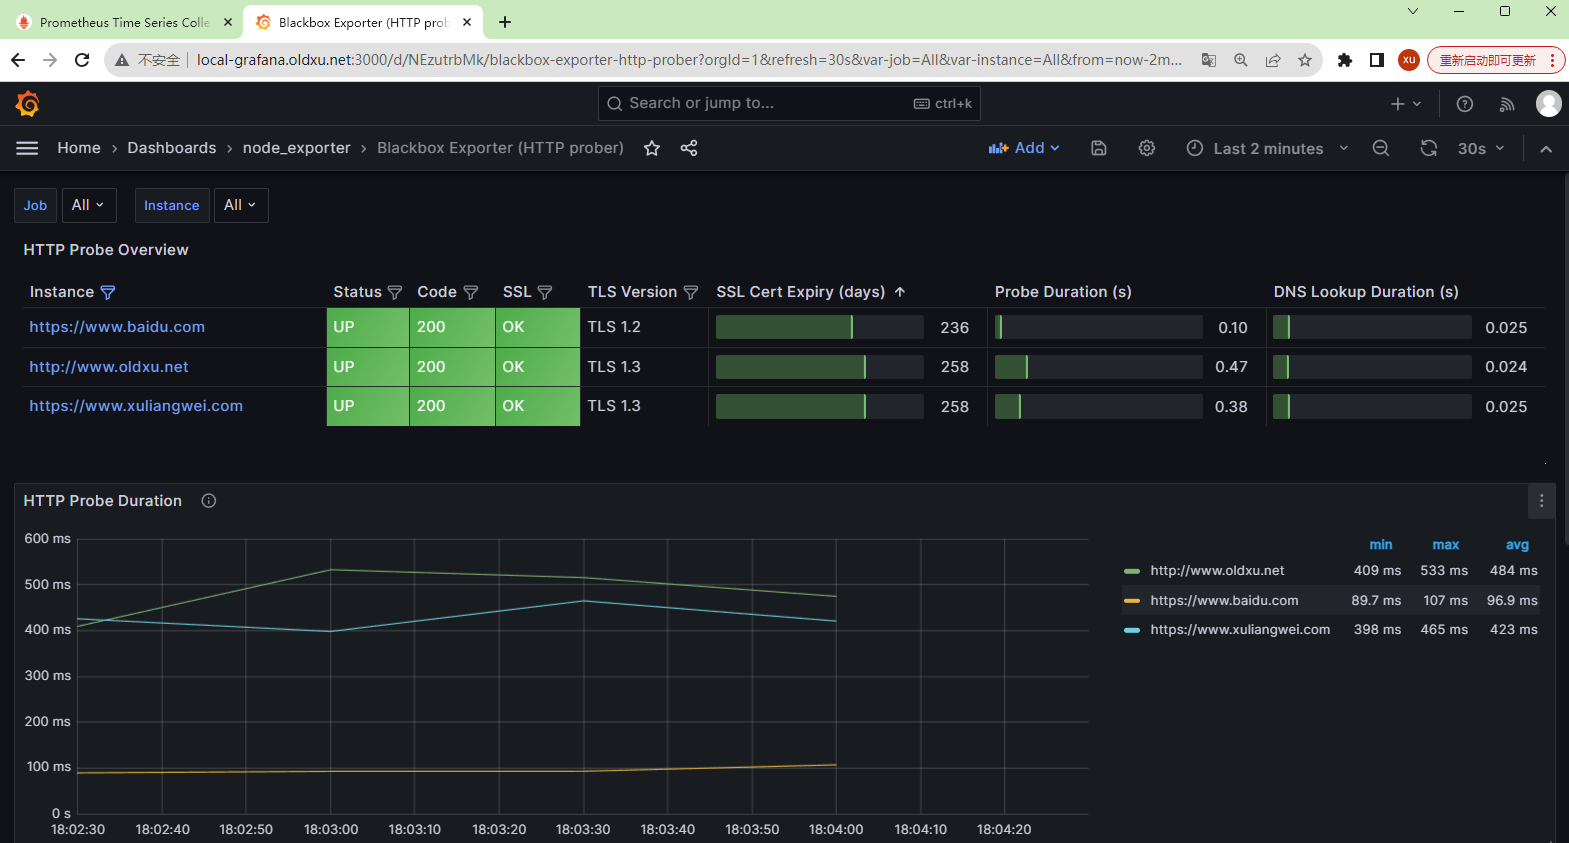
- 也可以使用
id7587的图形
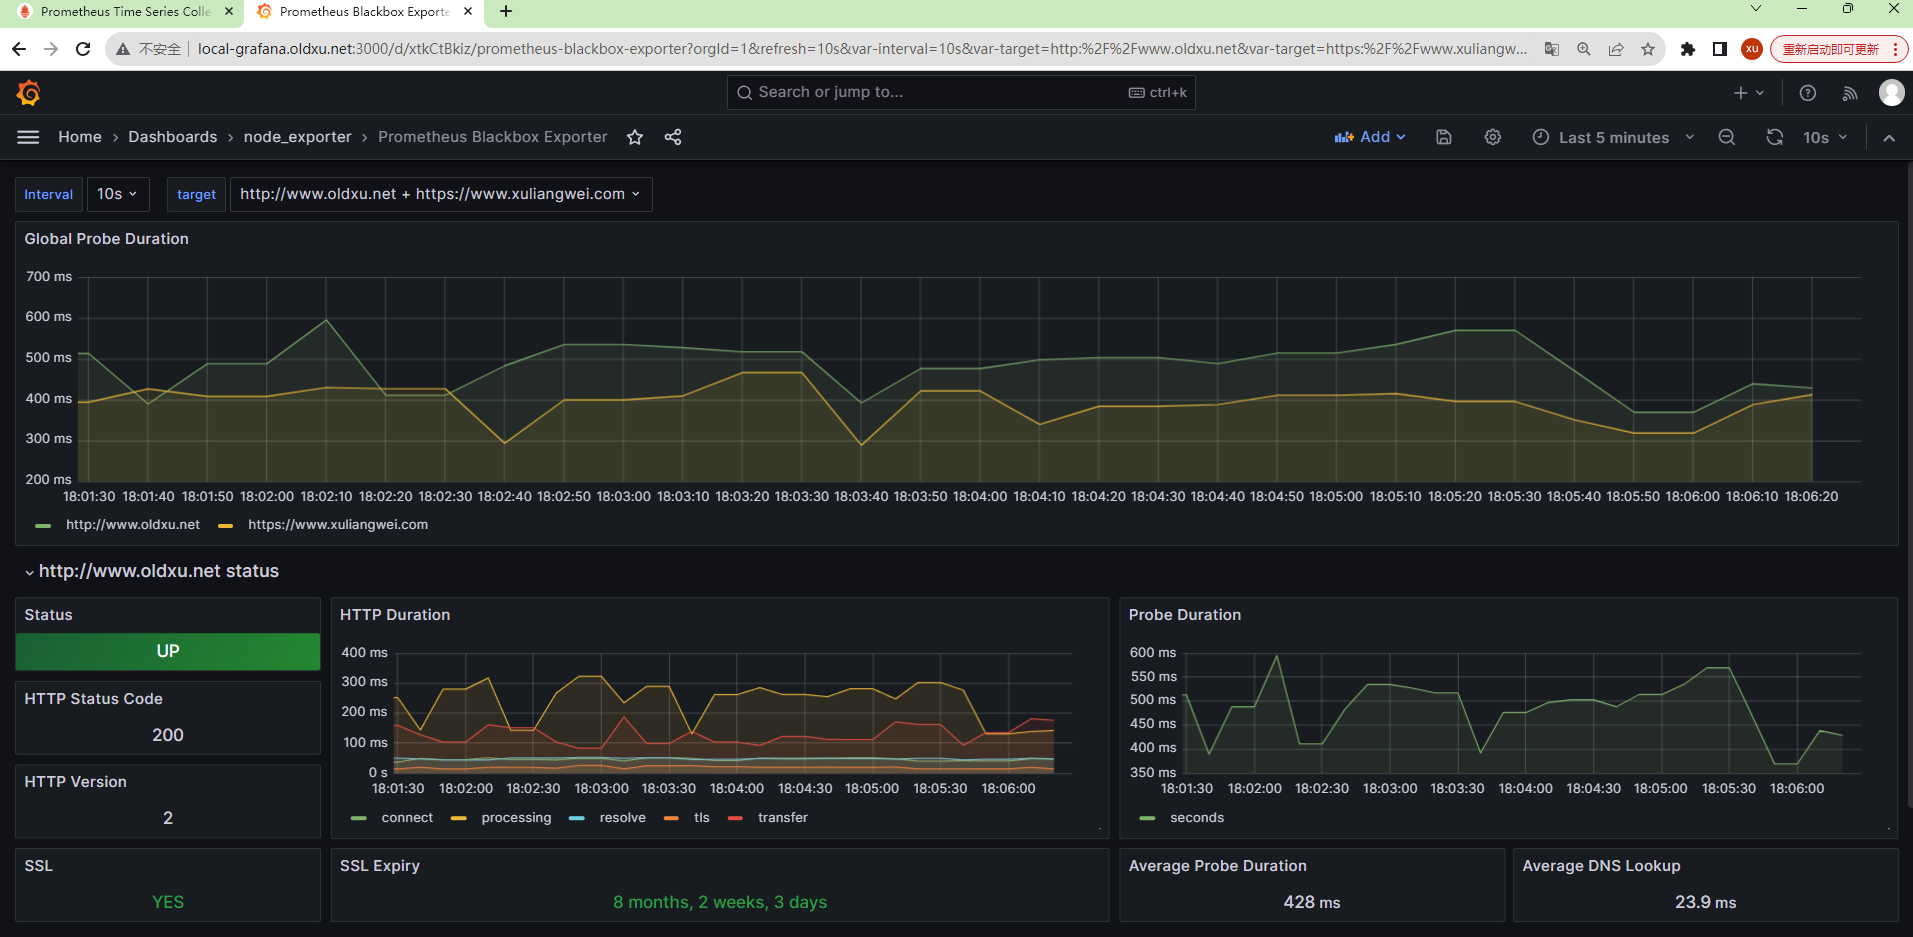
- 以及
id9965的图形
snmp_exporter网络设备监控
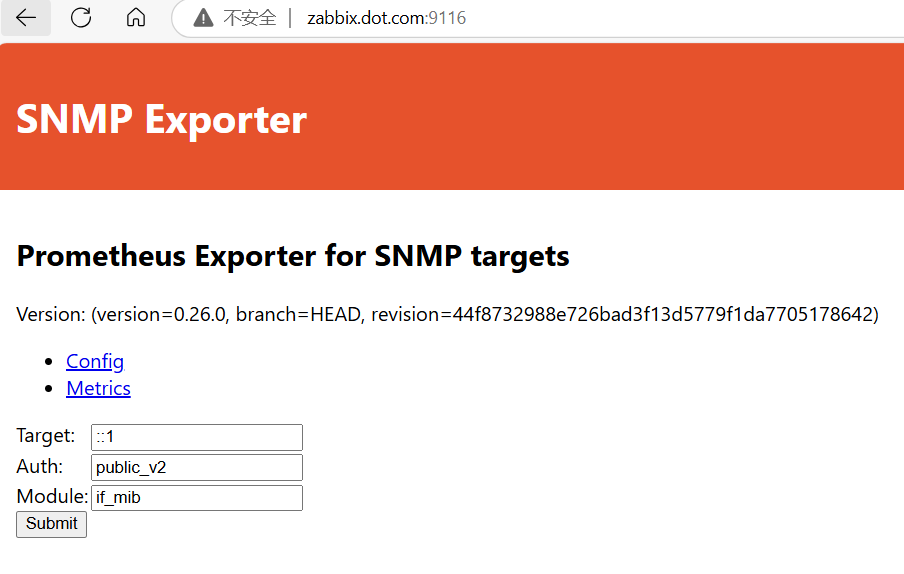
snmp_exporter介绍
snmp_exporter的作用是将snmp获取到的数据转换为prometheus可以兼容的格式。通过snmp_exporter,我们就可以监控那些支持snmp协议的设备,如交换机、路由器、防火墙等
prometheus借助snmp_exporter监控网络设备需要传递如下几个参数:
- 1.
target(目标设备的地址):需要监控的设备地址 - 2.
module(使用的模块):不同的模块,存储了不同设备的指标。(如果没有提供设备对应的指标,则需要定制) - 3.
auth(认证信息):提供snmp认证信息,如团体名称(community)
安装snmp_exporter
- 访问
snmp_exporter的github地址,https://github.com/prometheus/snmp_exporter/releases,下载snmp_exporter
# 加速地址
wget https://mirror.ghproxy.com/https://github.com/prometheus/snmp_exporter/releases/download/v0.26.0/snmp_exporter-0.26.0.linux-amd64.tar.gz- 解压
snmp_exporter
tar xf snmp_exporter-0.26.0.linux-amd64.tar.gz -C /etc/
ln -s /etc/snmp_exporter-0.26.0.linux-amd64/ /etc/snmp_exporter- 修改
snmp.yml配置文件的团体名称和认证方式(默认的snmp.yml提供的if_mib模块足够使用,特殊的指标需要先获取oid,然后通过generator程序来生成对应的指标,最后合并到snmp.yml的模块中)
generator
vim /etc/snmp_exporter/snmp.yml
auths:
public_v1:
community: public
security_level: noAuthNoPriv
auth_protocol: MD5
priv_protocol: DES
version: 1
public_v2:
community: 123456
security_level: noAuthNoPriv
auth_protocol: MD5
priv_protocol: DES
version: 2- 配置
snmp_exporter启动文件
cat /usr/lib/systemd/system/snmp_exporter.service
[Unit]
Description=snmp_exporter
Documentation=https://prometheus.io/
After=network.target

[Service]
ExecStart=/etc/snmp_exporter/snmp_exporter --web.listen-address=:9116 --config.file=/etc/snmp_exporter/snmp.yml
ExecReload=/bin/kill -HUP $MAINPID
TimeoutStopSec=20s
Restart=always

[Install]
WantedBy=multi-user.target- 启动
snmp_exporter
systemctl daemon-reload
systemctl enable snmp_exporter.service
systemctl start snmp_exporter.service
netstat -lntp
Active Internet connections (only servers)
Proto Recv-Q Send-Q Local Address           Foreign Address         State       PID/Program name
tcp6 0 0 :::9116 :::* LISTEN 108458/snmp_exporte- 访问
metrics
配置prometheus
- 修改
prometheus配置,使用relabel_configs做标签替换。
cat /etc/prometheus/prometheus.yml
scrape_configs:
  - job_name: 'snmp_exporter'
    scrape_interval: 60s
    scrape_timeout: 30s
    metrics_path: /snmp
    params:
      auth: [public_v2]
      module: [if_mib]
    static_configs:
      - targets: ["x.x.x.x"]
    relabel_configs:
    - source_labels: [__address__]
      target_label: __param_target
    - source_labels: [__param_target]
      target_label: instance
    - target_label: __address__
replacement: 192.168.99.4:9116-
重新加载
prometheus配置文件
curl -X POST http://localhost:9090/-/reload -
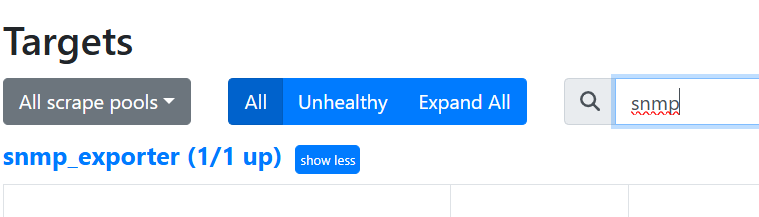
检查
prometheus的status-->targets页面,验证snmp_exporter是否已成功纳入监控
导入snmp_exporter图形
导入id12489、id12492
留言